Monitoring n8n with Grafana, Prometheus, PostgreSQL & Node Exporter
Sabri Hamid / October 24, 2025
Monitoring n8n with Grafana, Prometheus, PostgreSQL & Node Exporter
(Works in both Standard and Queue mode.)
Proper observability turns n8n from “cool automations” into a reliable platform.
This guide shows how to monitor application-level metrics from n8n (via PostgreSQL queries) and infrastructure health (via Node Exporter → Prometheus) — all visualized in Grafana.
You’ll end up with:
-
Dashboards for workflow executions, failures, durations, live status (PostgreSQL)
-
Panels for CPU, memory, disk, load (Prometheus/Node Exporter)
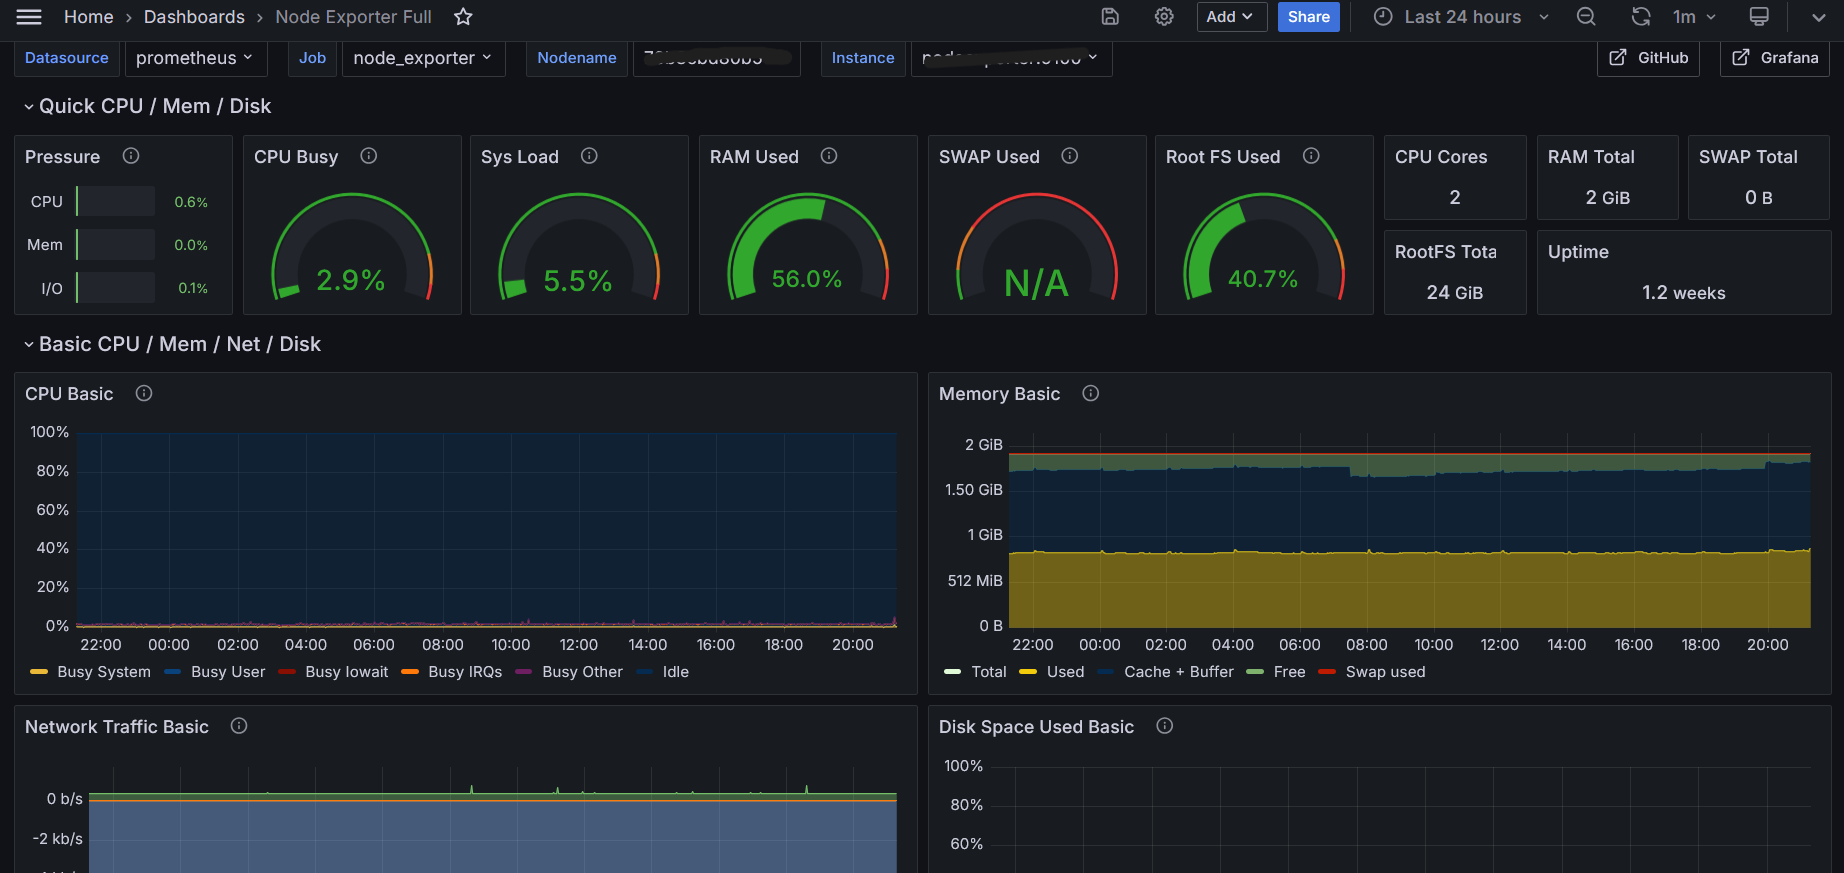
Table of Contents
- Stack Overview
- Docker Compose (Core)
- Prometheus Configuration
- Grafana: Add Data Sources
- Steps to access Grafana in the browser
- Create a new dashboard (Import)
Stack Overview
Core components (required):
- n8n
- PostgreSQL (n8n database + Grafana datasource)
- Node Exporter (host/container metrics on
:9100) - Prometheus (scrapes Node Exporter and itself)
- Grafana (dashboards + alerts)
Data flows:
n8n
 ├─ PostgreSQL → Grafana (SQL panels: executions, failures, durations, live status)
 └─ Node Exporter → Prometheus → Grafana (CPU, RAM, disk, load)
Docker Compose (Core)
Adjust versions, passwords, and volumes to your environment.
Click to view Docker compose config
services:
  n8n:
    image: n8nio/n8n:latest
    container_name: n8n
    restart: unless-stopped
    environment:
      - N8N_ENCRYPTION_KEY=<your_encryption_key>
      - DB_TYPE=postgresdb
      - DB_POSTGRESDB_HOST=postgres
      - DB_POSTGRESDB_PORT=5432
      - DB_POSTGRESDB_DATABASE=n8n
      - DB_POSTGRESDB_USER=n8n
      - DB_POSTGRESDB_PASSWORD=n8n_password
    ports:
      - "5678:5678"
    depends_on:
      - postgres

  postgres:
    image: postgres:15
    container_name: postgres
    restart: unless-stopped
    environment:
      - POSTGRES_USER=n8n
      - POSTGRES_PASSWORD=n8n_password
      - POSTGRES_DB=n8n
    volumes:
      - postgres_data:/var/lib/postgresql/data

  nodeexporter:
    image: prom/node-exporter:latest
    container_name: nodeexporter
    restart: unless-stopped
    pid: "host"
    ports:
      - "9100:9100"
    volumes:
      - /proc:/host/proc:ro
      - /sys:/host/sys:ro
      - /:/rootfs:ro
    command:
      - '--path.procfs=/host/proc'
      - '--path.sysfs=/host/sys'
      - '--path.rootfs=/rootfs'

  prometheus:
    image: prom/prometheus:v3.4.2
    container_name: prometheus
    restart: unless-stopped
    ports:
      - "9090:9090"
    volumes:
      - ./prometheus:/etc/prometheus
      - prometheus_data:/prometheus
    command: >
      --config.file=/etc/prometheus/prometheus.yml
      --storage.tsdb.path=/prometheus
      --storage.tsdb.retention.time=15d

  grafana:
    image: grafana/grafana:10.4.1
    container_name: grafana
    restart: unless-stopped
    ports:
      - "3000:3000"
    volumes:
      - grafana_data:/var/lib/grafana
    environment:
      - GF_SECURITY_ADMIN_USER=admin
      - GF_SECURITY_ADMIN_PASSWORD=admin
      - GF_USERS_ALLOW_SIGN_UP=false

volumes:
  postgres_data:
  prometheus_data:
  grafana_data:
If n8n runs on another host, adjust service names/ports and networks accordingly.
📜 Prometheus Configuration
Create ./prometheus/prometheus.yml so Prometheus scrapes Node Exporter and itself:
# ./prometheus/prometheus.yml
global:
  scrape_interval: 15s

scrape_configs:
  - job_name: 'prometheus'
    static_configs:
      - targets: ['localhost:9090']
  - job_name: 'n8n'
    static_configs:
      - targets: ['n8n:5678']
  - job_name: 'node_exporter'
    static_configs:
      - targets: ['nodeexporter:9100']
Steps to access Grafana in the browser
- Ensure Grafana is running: Start the Grafana server if it's not already active.
- Open your web browser: Launch your preferred web browser (e.g., Chrome, Firefox, Safari).
- Navigate to Grafana URL: In the address bar, type
http://localhost:3000and press Enter. (Replacelocalhostwith your server's IP address if Grafana is hosted remotely.) - Log in to Grafana: Use the default credentials:
- Username:
admin - Password:
admin
- Username:
- Change password: Upon first login, Grafana will prompt you to change the default password for security reasons. Follow the instructions to set a new password.
Grafana: Add Data Sources
1) PostgreSQL (Application-Level Metrics)
- Connections → Data sources → Add data source → PostgreSQL
- Host:
postgres:5432 - Database:
Database name; in our case "n8n" - Username:
Database username; in our case "n8n" - Password:
Database password; "n8n_password" - SSL Mode:
disable - Click Save & Test
2) Prometheus (System Metrics)
- Connections → Data sources → Add data source → Prometheus
- URL:
http://prometheus:9090 - Click Save & Test
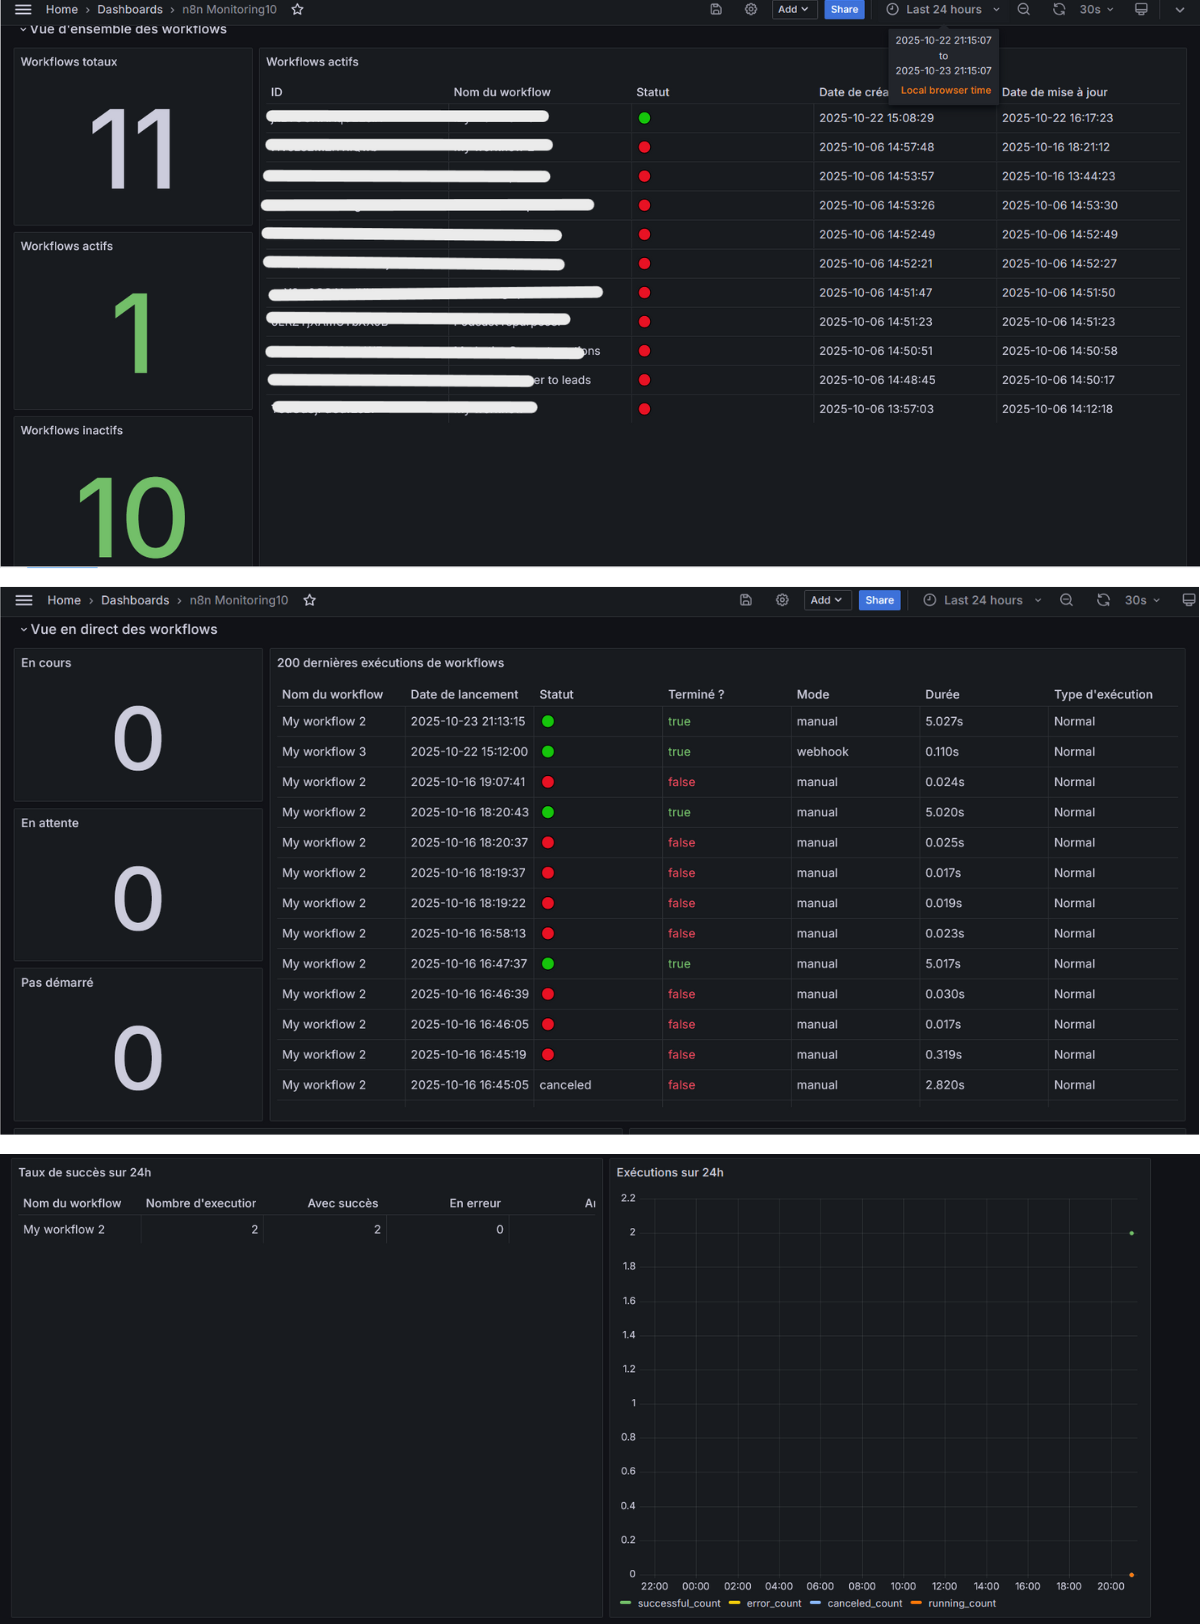
Create a new dashboard (Import)
N8N PostgreSQL Dashboard
- In Grafana, click Dashboards → New → Import
- Paste JSON from your n8n PostgreSQL dashboard into the text area
- Click Import
- Dashboard settings select variables then New variable then variable
- Type:
Datasource - name:
ds_postgresql - Label:
Datasource - Datasource options:
PostgreSQL - Click Apply
Note: the variable name must match the one used in the JSON (
$(ds_postgresql))
View n8n PostgreSQL Dashboard JSON
{
"annotations": {
"list": [
{
"builtIn": 1,
"datasource": {
"type": "grafana",
"uid": "-- Grafana --"
},
"enable": true,
"hide": true,
"iconColor": "rgba(0, 211, 255, 1)",
"name": "Annotations & Alerts",
"type": "dashboard"
}
]
},
"editable": true,
"fiscalYearStartMonth": 0,
"graphTooltip": 1,
"id": 0,
"links": [],
"panels": [
{
"collapsed": false,
"gridPos": {
"h": 1,
"w": 24,
"x": 0,
"y": 0
},
"id": 5,
"panels": [],
"title": "Workflow Overview",
"type": "row"
},
{
"datasource": {
"type": "grafana-postgresql-datasource",
"uid": "$(ds_postgresql)"
},
"fieldConfig": {
"defaults": {
"color": {
"mode": "thresholds"
},
"mappings": [],
"thresholds": {
"mode": "absolute",
"steps": [
{
"color": "text",
"value": null
}
]
}
},
"overrides": []
},
"gridPos": {
"h": 6,
"w": 5,
"x": 0,
"y": 1
},
"id": 2,
"options": {
"colorMode": "value",
"graphMode": "area",
"justifyMode": "auto",
"orientation": "horizontal",
"percentChangeColorMode": "standard",
"reduceOptions": {
"calcs": [
"lastNotNull"
],
"fields": "",
"values": false
},
"showPercentChange": false,
"textMode": "auto",
"wideLayout": true
},
"pluginVersion": "10.4.1",
"targets": [
{
"datasource": {
"type": "grafana-postgresql-datasource",
"uid": "$(ds_postgresql)"
},
"editorMode": "code",
"format": "table",
"rawQuery": true,
"rawSql": "SELECT COUNT(*) as total_workflows FROM workflow_entity;",
"refId": "A"
}
],
"title": "Total Workflows",
"type": "stat"
},
{
"datasource": {
"type": "grafana-postgresql-datasource",
"uid": "$(ds_postgresql)"
},
"fieldConfig": {
"defaults": {
"color": {
"fixedColor": "red",
"mode": "thresholds"
},
"custom": {
"align": "auto",
"cellOptions": {
"type": "color-text"
},
"inspect": false
},
"mappings": [
{
"options": {
"false": {
"color": "red",
"index": 0,
"text": "🔴"
},
"true": {
"color": "green",
"index": 1,
"text": "🟢"
}
},
"type": "value"
}
],
"thresholds": {
"mode": "absolute",
"steps": [
{
"color": "text",
"value": null
}
]
}
},
"overrides": []
},
"gridPos": {
"h": 18,
"w": 19,
"x": 5,
"y": 1
},
"id": 1,
"options": {
"cellHeight": "sm",
"footer": {
"countRows": false,
"fields": "",
"reducer": [
"sum"
],
"show": false
},
"showHeader": true,
"sortBy": []
},
"pluginVersion": "10.4.1",
"targets": [
{
"datasource": {
"type": "grafana-postgresql-datasource",
"uid": "$(ds_postgresql)"
},
"editorMode": "code",
"format": "table",
"rawQuery": true,
"rawSql": "SELECT id, name as workflow_name, active, \"createdAt\", \"updatedAt\" FROM workflow_entity ORDER BY \"updatedAt\" DESC LIMIT 20;",
"refId": "A"
}
],
"title": "Active Workflows",
"transformations": [
{
"id": "organize",
"options": {
"renameByName": {
"active": "Status",
"createdAt": "Creation Date",
"id": "ID",
"updatedAt": "Last Updated",
"workflow_name": "Workflow Name"
}
}
}
],
"type": "table"
},
{
"datasource": {
"type": "grafana-postgresql-datasource",
"uid": "$(ds_postgresql)"
},
"fieldConfig": {
"defaults": {
"color": {
"mode": "thresholds"
},
"mappings": [],
"thresholds": {
"mode": "absolute",
"steps": [
{
"color": "green",
"value": null
},
{
"color": "red",
"value": 80
}
]
}
},
"overrides": []
},
"gridPos": {
"h": 6,
"w": 5,
"x": 0,
"y": 7
},
"id": 3,
"options": {
"colorMode": "value",
"graphMode": "area",
"justifyMode": "auto",
"orientation": "horizontal",
"reduceOptions": {
"calcs": [
"lastNotNull"
],
"fields": "",
"values": false
},
"showPercentChange": false,
"textMode": "auto",
"wideLayout": true
},
"pluginVersion": "10.4.1",
"targets": [
{
"datasource": {
"type": "grafana-postgresql-datasource",
"uid": "$(ds_postgresql)"
},
"editorMode": "code",
"format": "table",
"rawQuery": true,
"rawSql": "SELECT COUNT(*) as active_workflows FROM workflow_entity WHERE active = true;",
"refId": "A"
}
],
"title": "Active Workflows",
"type": "stat"
},
{
"datasource": {
"type": "grafana-postgresql-datasource",
"uid": "$(ds_postgresql)"
},
"fieldConfig": {
"defaults": {
"color": {
"mode": "thresholds"
},
"mappings": [],
"thresholds": {
"mode": "absolute",
"steps": [
{
"color": "green",
"value": null
},
{
"color": "red",
"value": 80
}
]
}
},
"overrides": []
},
"gridPos": {
"h": 6,
"w": 5,
"x": 0,
"y": 13
},
"id": 4,
"options": {
"colorMode": "value",
"graphMode": "area",
"justifyMode": "auto",
"orientation": "horizontal",
"reduceOptions": {
"calcs": [
"lastNotNull"
],
"fields": "",
"values": false
},
"showPercentChange": false,
"textMode": "auto",
"wideLayout": true
},
"pluginVersion": "10.4.1",
"targets": [
{
"datasource": {
"type": "grafana-postgresql-datasource",
"uid": "$(ds_postgresql)"
},
"editorMode": "code",
"format": "table",
"rawQuery": true,
"rawSql": "SELECT COUNT(*) as inactive_workflows FROM workflow_entity WHERE active = false;",
"refId": "A"
}
],
"title": "Inactive Workflows",
"type": "stat"
},
{
"collapsed": false,
"gridPos": {
"h": 1,
"w": 24,
"x": 0,
"y": 19
},
"id": 6,
"panels": [],
"title": "Live Workflow View",
"type": "row"
},
{
"datasource": {
"type": "grafana-postgresql-datasource",
"uid": "$(ds_postgresql)"
},
"fieldConfig": {
"defaults": {
"color": {
"mode": "thresholds"
},
"mappings": [],
"thresholds": {
"mode": "absolute",
"steps": [
{
"color": "text"
},
{
"color": "green",
"value": 1
}
]
}
},
"overrides": []
},
"gridPos": {
"h": 5,
"w": 5,
"x": 0,
"y": 20
},
"id": 7,
"options": {
"colorMode": "value",
"graphMode": "area",
"justifyMode": "auto",
"orientation": "auto",
"percentChangeColorMode": "standard",
"reduceOptions": {
"calcs": [
"lastNotNull"
],
"fields": "",
"values": false
},
"showPercentChange": false,
"textMode": "auto",
"wideLayout": true
},
"pluginVersion": "10.4.1",
"targets": [
{
"datasource": {
"type": "grafana-postgresql-datasource",
"uid": "$(ds_postgresql)"
},
"editorMode": "code",
"format": "table",
"rawQuery": true,
"rawSql": "SELECT COUNT(*) as running_executions FROM execution_entity WHERE finished = false AND \"stoppedAt\" IS NULL AND \"startedAt\" IS NOT NULL AND \"deletedAt\" IS NULL;",
"refId": "A"
}
],
"title": "Running",
"type": "stat"
},
{
"datasource": {
"type": "grafana-postgresql-datasource",
"uid": "$(ds_postgresql)"
},
"fieldConfig": {
"defaults": {
"color": {
"mode": "thresholds"
},
"custom": {
"align": "auto",
"cellOptions": {
"type": "color-text"
},
"inspect": false
},
"mappings": [
{
"options": {
"error": {
"color": "red",
"index": 1,
"text": "🔴"
},
"success": {
"color": "green",
"index": 0,
"text": "🟢"
}
},
"type": "value"
}
],
"thresholds": {
"mode": "absolute",
"steps": [
{
"color": "text"
}
]
}
},
"overrides": []
},
"gridPos": {
"h": 15,
"w": 18,
"x": 5,
"y": 20
},
"id": 9,
"options": {
"cellHeight": "sm",
"footer": {
"countRows": false,
"fields": "",
"reducer": [
"sum"
],
"show": false
},
"showHeader": true,
"sortBy": []
},
"pluginVersion": "10.4.1",
"targets": [
{
"datasource": {
"type": "grafana-postgresql-datasource",
"uid": "$(ds_postgresql)"
},
"editorMode": "code",
"format": "table",
"rawQuery": true,
"rawSql": "SELECT \n we.name as workflow_name,\n ee.\"startedAt\" as started_at,\n ee.status as execution_status,\n ee.finished,\n ee.mode as execution_mode,\n CASE \n WHEN ee.\"stoppedAt\" IS NOT NULL AND ee.\"startedAt\" IS NOT NULL \n THEN CONCAT(ROUND(EXTRACT(EPOCH FROM (ee.\"stoppedAt\" - ee.\"startedAt\"))::numeric, 3), 's')\n WHEN ee.\"stoppedAt\" IS NULL AND ee.\"startedAt\" IS NOT NULL THEN 'Running'\n ELSE 'Not Started'\n END as duration,\n CASE \n WHEN ee.\"retryOf\" IS NOT NULL THEN 'Retry'\n WHEN ee.\"waitTill\" IS NOT NULL AND ee.\"waitTill\" > NOW() THEN 'Waiting'\n ELSE 'Normal'\n END as execution_type\nFROM execution_entity ee\nJOIN workflow_entity we ON we.id::text = ee.\"workflowId\"\nWHERE ee.\"deletedAt\" IS NULL\nORDER BY ee.\"startedAt\" DESC NULLS LAST\nLIMIT 200;",
"refId": "A"
}
],
"title": "Last 200 Workflow Executions",
"transformations": [
{
"id": "organize",
"options": {
"renameByName": {
"duration": "Duration",
"execution_mode": "Mode",
"execution_status": "Status",
"execution_type": "Execution Type",
"finished": "Finished?",
"started_at": "Start Time",
"workflow_name": "Workflow Name"
}
}
}
],
"type": "table"
},
{
"datasource": {
"type": "grafana-postgresql-datasource",
"uid": "$(ds_postgresql)"
},
"fieldConfig": {
"defaults": {
"color": {
"mode": "thresholds"
},
"mappings": [],
"thresholds": {
"mode": "absolute",
"steps": [
{
"color": "text"
}
]
}
},
"overrides": []
},
"gridPos": {
"h": 5,
"w": 5,
"x": 0,
"y": 25
},
"id": 8,
"options": {
"colorMode": "value",
"graphMode": "area",
"justifyMode": "auto",
"orientation": "auto",
"percentChangeColorMode": "standard",
"reduceOptions": {
"calcs": [
"lastNotNull"
],
"fields": "",
"values": false
},
"showPercentChange": false,
"textMode": "auto",
"wideLayout": true
},
"pluginVersion": "10.4.1",
"targets": [
{
"datasource": {
"type": "grafana-postgresql-datasource",
"uid": "$(ds_postgresql)"
},
"editorMode": "code",
"format": "table",
"rawQuery": true,
"rawSql": "SELECT COUNT(*) as waiting_executions FROM execution_entity WHERE \"waitTill\" IS NOT NULL AND \"waitTill\" > NOW() AND \"deletedAt\" IS NULL;",
"refId": "A"
}
],
"title": "Waiting",
"type": "stat"
},
{
"datasource": {
"type": "grafana-postgresql-datasource",
"uid": "$(ds_postgresql)"
},
"fieldConfig": {
"defaults": {
"color": {
"mode": "thresholds"
},
"mappings": [],
"thresholds": {
"mode": "absolute",
"steps": [
{
"color": "text"
}
]
}
},
"overrides": []
},
"gridPos": {
"h": 5,
"w": 5,
"x": 0,
"y": 30
},
"id": 10,
"options": {
"colorMode": "value",
"graphMode": "area",
"justifyMode": "auto",
"orientation": "auto",
"percentChangeColorMode": "standard",
"reduceOptions": {
"calcs": [
"lastNotNull"
],
"fields": "",
"values": false
},
"showPercentChange": false,
"textMode": "auto",
"wideLayout": true
},
"pluginVersion": "10.4.1",
"targets": [
{
"datasource": {
"type": "grafana-postgresql-datasource",
"uid": "$(ds_postgresql)"
},
"editorMode": "code",
"format": "table",
"rawQuery": true,
"rawSql": "SELECT COUNT(*) as queued_executions FROM execution_entity WHERE \"startedAt\" IS NULL AND finished = false AND \"deletedAt\" IS NULL;",
"refId": "A"
}
],
"title": "Not Started",
"type": "stat"
},
{
"datasource": {
"type": "grafana-postgresql-datasource",
"uid": "$(ds_postgresql)"
},
"fieldConfig": {
"defaults": {
"color": {
"mode": "thresholds"
},
"custom": {
"align": "auto",
"cellOptions": {
"type": "auto"
},
"inspect": false
},
"mappings": [],
"thresholds": {
"mode": "absolute",
"steps": [
{
"color": "green"
},
{
"color": "red",
"value": 80
}
]
}
},
"overrides": []
},
"gridPos": {
"h": 15,
"w": 12,
"x": 0,
"y": 35
},
"id": 11,
"options": {
"cellHeight": "sm",
"footer": {
"countRows": false,
"fields": "",
"reducer": [
"sum"
],
"show": false
},
"showHeader": true,
"sortBy": [
{
"desc": true,
"displayName": "Running"
}
]
},
"pluginVersion": "10.4.1",
"targets": [
{
"datasource": {
"type": "grafana-postgresql-datasource",
"uid": "$(ds_postgresql)"
},
"editorMode": "code",
"format": "table",
"rawQuery": true,
"rawSql": "SELECT \n we.name as workflow_name,\n COUNT(ee.\"workflowId\") as total_executions,\n COUNT(CASE WHEN ee.status = 'success' THEN 1 END) as successful,\n COUNT(CASE WHEN ee.status = 'error' THEN 1 END) as failed,\n COUNT(CASE WHEN ee.status = 'canceled' THEN 1 END) as canceled,\n COUNT(CASE WHEN ee.finished = false \n AND ee.\"stoppedAt\" IS NULL \n AND ee.\"startedAt\" IS NOT NULL \n AND ee.\"deletedAt\" IS NULL THEN 1 END) as running,\n ROUND(\n (\n COUNT(CASE WHEN ee.status = 'success' THEN 1 END) * 100.0\n / NULLIF(\n COUNT(CASE WHEN ee.status IN ('success','error','canceled') THEN 1 END)\n , 0)\n ), 1\n ) as success_rate_percent\nFROM workflow_entity we\nJOIN execution_entity ee ON we.id::text = ee.\"workflowId\"\nWHERE ee.\"startedAt\" >= NOW() - INTERVAL '24 hours'\n AND ee.\"deletedAt\" IS NULL\nGROUP BY we.id, we.name\nHAVING COUNT(ee.\"workflowId\") > 0\nORDER BY total_executions DESC;",
"refId": "A"
}
],
"title": "Success Rate over 24h",
"transformations": [
{
"id": "organize",
"options": {
"renameByName": {
"canceled": "Canceled",
"failed": "Failed",
"running": "Running",
"success_rate_percent": "Success Rate (%)",
"successful": "Successful",
"total_executions": "Total Executions",
"workflow_name": "Workflow Name"
}
}
}
],
"type": "table"
},
{
"datasource": {
"type": "grafana-postgresql-datasource",
"uid": "$(ds_postgresql)"
},
"fieldConfig": {
"defaults": {
"color": {
"mode": "palette-classic"
},
"custom": {
"axisBorderShow": false,
"axisCenteredZero": false,
"axisColorMode": "text",
"axisLabel": "",
"axisPlacement": "auto",
"barAlignment": 0,
"drawStyle": "line",
"fillOpacity": 0,
"gradientMode": "none",
"hideFrom": {
"legend": false,
"tooltip": false,
"viz": false
},
"insertNulls": false,
"lineInterpolation": "linear",
"lineWidth": 1,
"pointSize": 5,
"scaleDistribution": {
"type": "linear"
},
"showPoints": "auto",
"spanNulls": false,
"stacking": {
"group": "A",
"mode": "none"
},
"thresholdsStyle": {
"mode": "off"
}
},
"mappings": [],
"thresholds": {
"mode": "absolute",
"steps": [
{
"color": "green"
},
{
"color": "red",
"value": 80
}
]
}
},
"overrides": []
},
"gridPos": {
"h": 15,
"w": 11,
"x": 12,
"y": 35
},
"id": 12,
"options": {
"legend": {
"calcs": [],
"displayMode": "list",
"placement": "bottom",
"showLegend": true
},
"tooltip": {
"hideZeros": false,
"mode": "single",
"sort": "none"
}
},
"pluginVersion": "12.0.1",
"targets": [
{
"datasource": {
"type": "grafana-postgresql-datasource",
"uid": "$(ds_postgresql)"
},
"editorMode": "code",
"format": "table",
"rawQuery": true,
"rawSql": "SELECT \n DATE_TRUNC('hour', ee.\"startedAt\") as hour_bucket,\n COUNT(CASE WHEN ee.status = 'success' THEN 1 END) as successful_count,\n COUNT(CASE WHEN ee.status = 'error' THEN 1 END) as error_count,\n COUNT(CASE WHEN ee.status = 'canceled' THEN 1 END) as canceled_count,\n COUNT(CASE WHEN ee.finished = false \n AND ee.\"stoppedAt\" IS NULL \n AND ee.\"startedAt\" IS NOT NULL \n AND ee.\"deletedAt\" IS NULL THEN 1 END) as running_count\nFROM execution_entity ee\nWHERE ee.\"startedAt\" >= NOW() - INTERVAL '24 hours'\n AND ee.\"deletedAt\" IS NULL\nGROUP BY DATE_TRUNC('hour', ee.\"startedAt\")\nORDER BY hour_bucket;",
"refId": "A"
}
],
"title": "Executions over 24h",
"type": "timeseries"
}
],
"refresh": "30s",
"schemaVersion": 39,
"tags": [
"n8n",
"monitoring"
],
"templating": {
"list": []
},
"time": {
"from": "now-24h",
"to": "now"
},
"timepicker": {},
"timezone": "browser",
"title": "n8n Monitoring",
"uid": "n8n-monitoring",
"version": 1,
"weekStart": ""
}
Node Exporter Dashboard
- In Grafana, click Dashboards → New → Import
- Paste this ID : 1860 into the text area
- Click Load
I offer consulting and infrastructure setup for n8n monitoring and observability - contact me